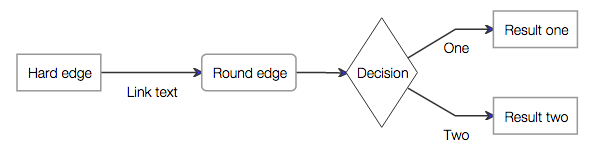
mermaid – markdown-like generation of flowcharts and diagrams. This is like a web-oriented, d3-based implementation of the dot tool from the GraphViz package.
What were the technical limits that Twitter reached with Ruby on Rails?
Quora question that has some well researched answers. This is quite handy for any system architect or web developer.
MetricsGraphics.js – D3-based library for visualizing time-series data.