It’s not a secret that I’m a big fan of GraphViz – powerful, yet easy to use graph visualization software. And I’ve blog about it quite a few times. Well, guess what – today is a perfect day for one more post.
Over the weekend I was working on refactoring some CakePHP code that I had my on for a long time now. As with any powerful framework, the projects can get quite big and it might be difficult to make sense of the hierarchy and relationship of certain files, especially if it’s been a while since you looked at that code, and you are not a fan of IDEs, and you’ve been non-stop coding for more than 24 hours.
I had this problem once or twice before. To the extent that I’ve written a CakePHP plugin, which was using GraphViz to visualize models and their relationships. But that was a long time ago. The plugin got outdated (it was for CakePHP 1 and/or 2, so not very useful now that we are in version 3). Furthermore, today I needed to look not at the models and their relationships, but at a hierarchy of the PHP classes in some other directory.
A quick Google search suggested Nigel Chapman’s post – How to Generate PHP Class Inheritance Diagrams in Graphviz. Not only it was pretty much exactly what I was looking for, but it was also from a fellow CakePHP developer!

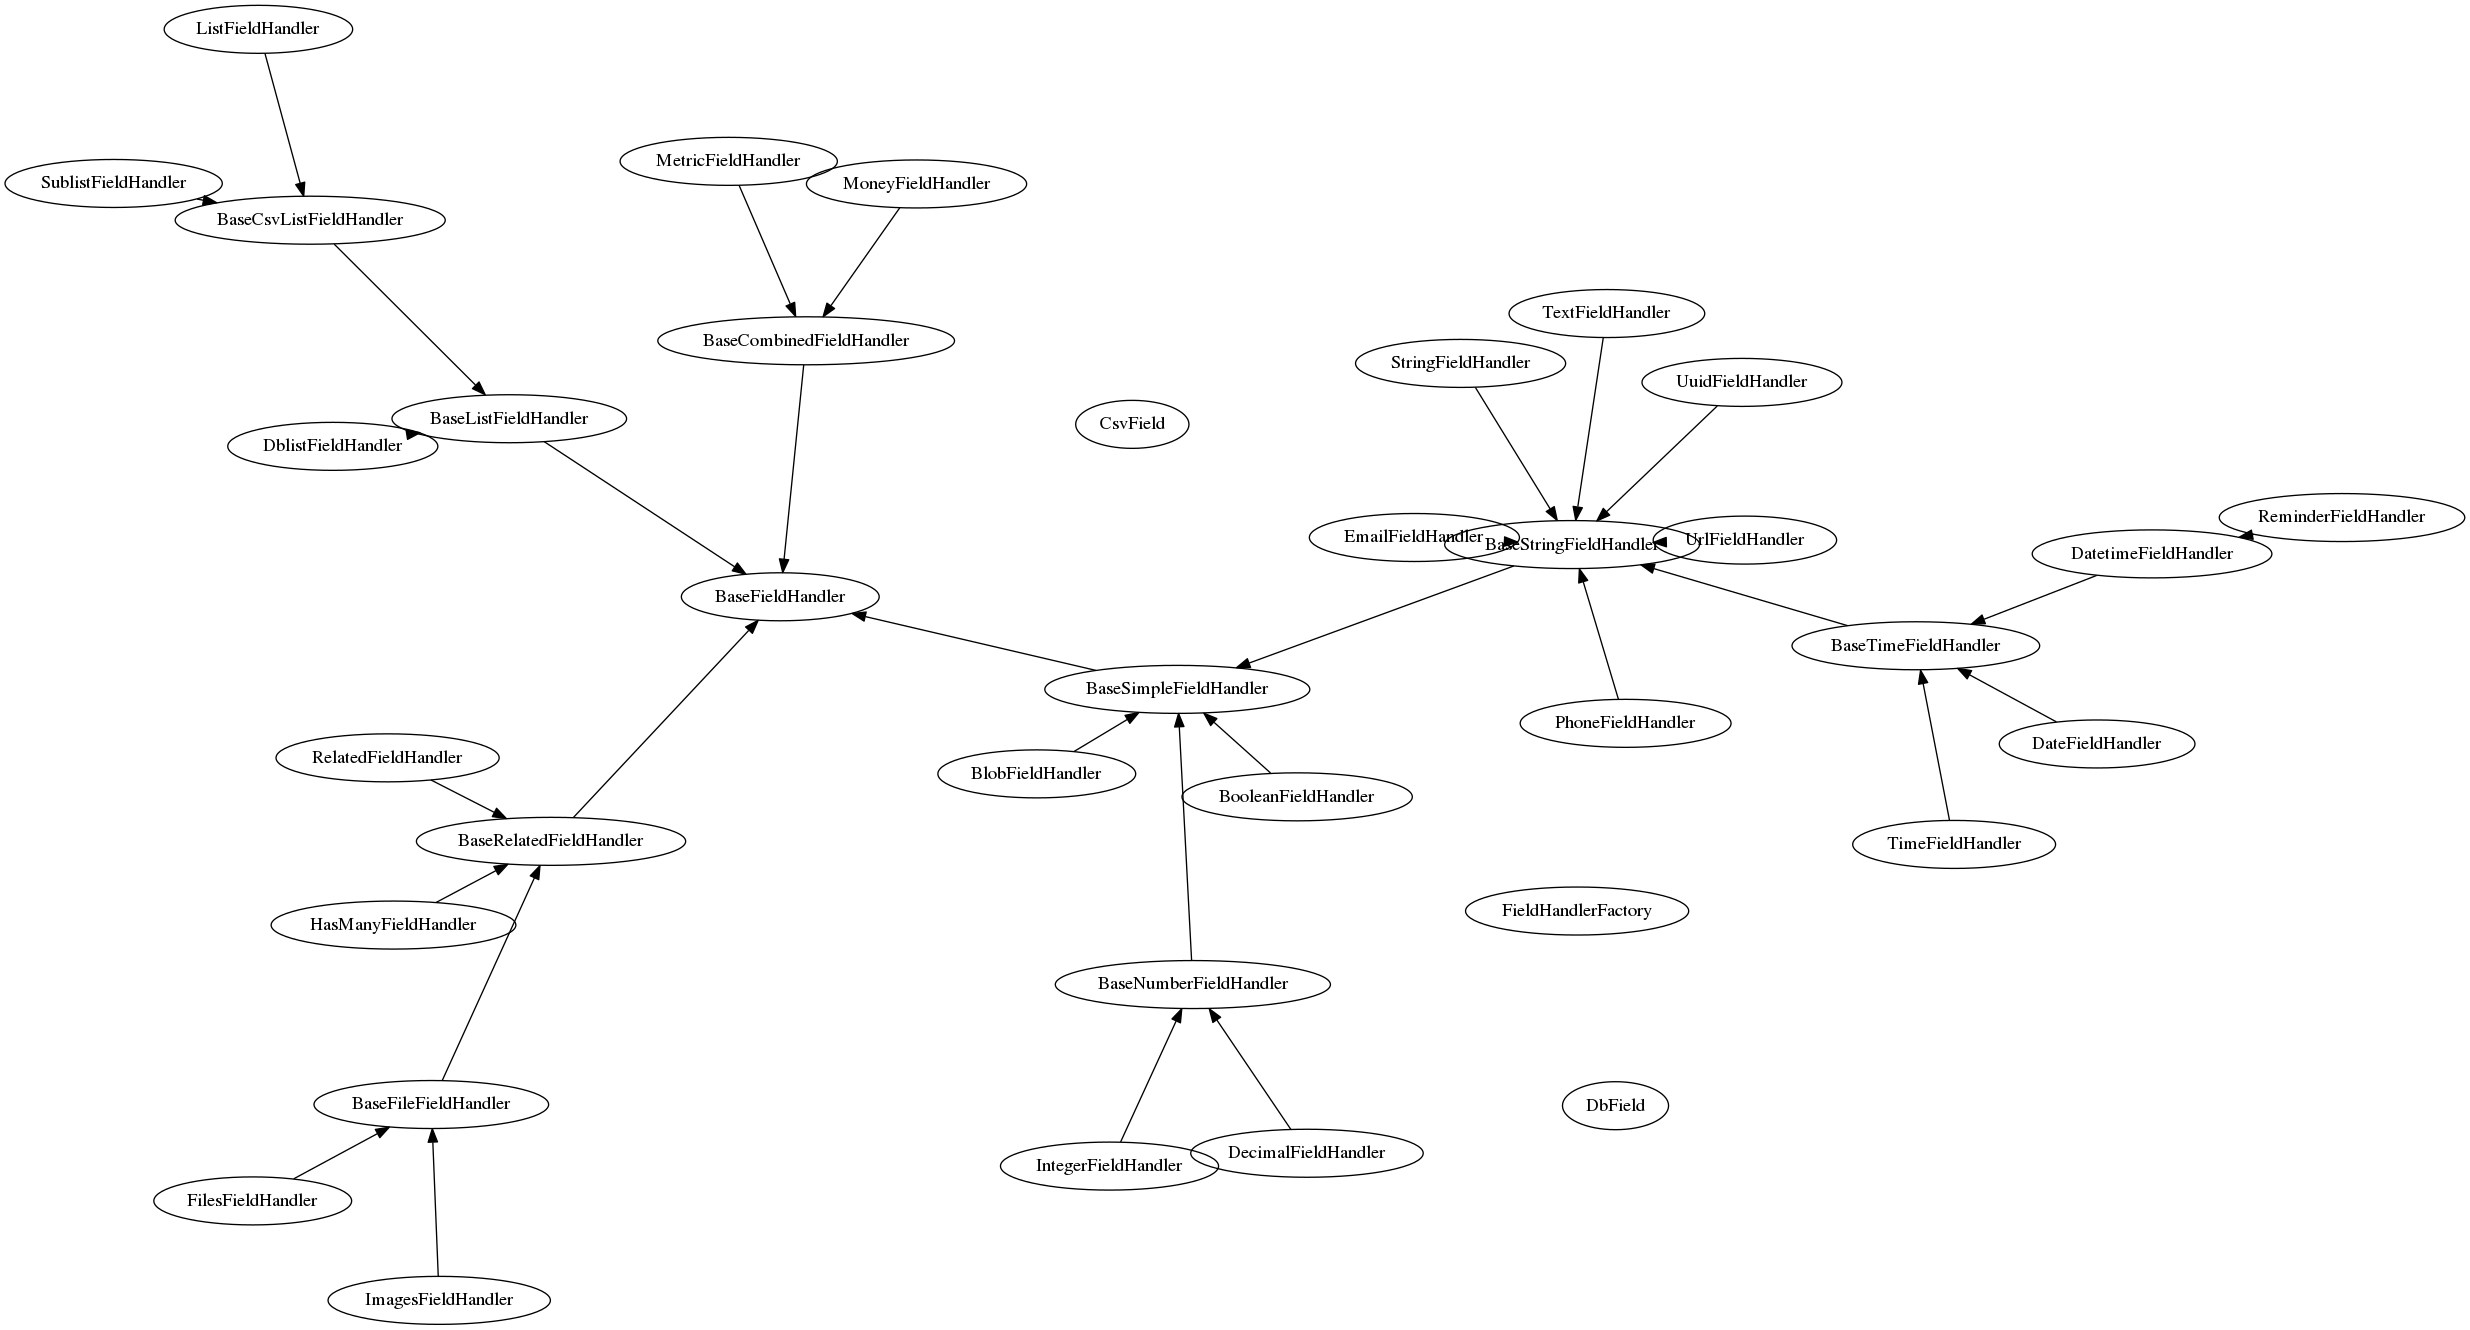
I’ve taken (borrowed?) Nigel’s script and modified it slightly. You can find my version here. The changes are:
- Added two parameters which allow to specify the name of the destination file and the GraphViz tool to use for the generation of the graph (more on that below). If omitted, the destination file will be created with the temporary name in the temporary directory, and the sfdp script will be used as default.
- Added the resulting path to the output at the end of the execution of the script, so that if it is a temporary file, I would know where to look for it.
- Added grep and sed patterns to work correctly with abstract classes.
- Changed grep to look only for the *.php files, instead of anything. This can make things much faster on messy projects, and it also removes the need for working around the binary files.
Now it’s so handy that I made it a part of my dotfiles, so that I can save a few precious moments looking for the solution in 2024.
This also seems like a good opportunity to review the which tools are available for generating the graph and what are the differences between them. For that, we don’t need to look any further than the front page of the GraphViz website (in the Roadmap section):
dot – “hierarchical” or layered drawings of directed graphs. This is the default tool to use if edges have directionality.
neato – “spring model” layouts. This is the default tool to use if the graph is not too large (about 100 nodes) and you don’t know anything else about it. Neato attempts to minimize a global energy function, which is equivalent to statistical multi-dimensional scaling.
fdp – “spring model” layouts similar to those of neato, but does this by reducing forces rather than working with energy.
sfdp – multiscale version of fdp for the layout of large graphs.
twopi – radial layouts, after Graham Wills 97. Nodes are placed on concentric circles depending their distance from a given root node.
circo – circular layout, after Six and Tollis 99, Kauffman and Wiese 02. This is suitable for certain diagrams of multiple cyclic structures, such as certain telecommunications networks.
As they say, GraphViz to the rescue once again!