SmartDraw – The Smartest Way to Draw Anything

It’s not often that I need to draw a diagram or a flowchart these days.  My time is mostly consumed by more technically challenging tasks.  And whenever I do have to produce some form of a chart, I usually fallback on to the Graphviz dot, which allows me to do something in literally seconds.
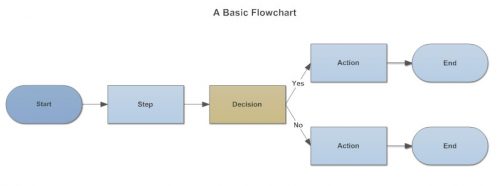
basic-flowchart

However, I’m pretty sure the day will (or, rather, return) when I’d need a tool to produce eye-pleasing diagrams and flowcharts.  For that day, and for that day only, I’m leaving the link to SmartDraw here.  It’s a commercial offering, but at $15/month for their cloud-hosted web-based application, it’s seems to be quite a bargain.

devices-cloud-buy

Using Graphviz dot for ERDs, network diagrams and more

I’ve mentioned Graphviz many a time on this blog.  It’s simple to use, yet very powerful.  The dot language is something that can be jotted down by hand in the simplest of all text editors, or generated programmatically.

The official website features a gallery, which demonstrates a wide range of graphs.  But I still wanted to blog a few examples from my recent use.

Continue reading Using Graphviz dot for ERDs, network diagrams and more

mermaid – markdown-like generation of flowcharts and diagrams

mermaid – markdown-like generation of flowcharts and diagrams.  This is like a web-oriented, d3-based implementation of the dot tool from the GraphViz package.


graph

vis.js – a visual interaction system

vis.js – a visual interaction system

Vis.js is a dynamic, browser based visualization library. The library is designed to be easy to use, to handle large amounts of dynamic data, and to enable manipulation of and interaction with the data. The library consists of the components DataSet, Timeline, and Graph.

The vis.js library is developed by Almende B.V, as part of CHAP. Vis.js runs fine on Chrome, Firefox, Opera, Safari, IE9+, and most mobile browsers (with full touch support).

CakePHP GraphViz Models

I have completely and totally rewritten my old script that generates a graph of CakePHP models and their relationships.  Instead of pasting the code in here, I pushed all of its development to GitHub where it now enjoys a new repository.  Please have a look, try it out, and let me know if it does or doesn’t work for you.

The major changes in this version are:

  • Rewritten as CakePHP Shell instead of being a standalone madness script.
  • Got rid of all dot markup. Utilized Image_GraphViz PEAR package instead.
  • Added support for old and new CakePHP versions (1.2, 1.3, and 2.0).
  • Added option for using only real models (via className property of the relationship) or sticking with the old behavior.
  • Added a bunch of options for tweaking GraphViz output.  And now it’s obvious where to edit them, in case you need more.
  • Improved the styling of the graph a bit – fonts and colors.
  • Improved documentation.

As a side effect improvement, now that it is a native CakePHP Shell, it’s trivial to add to your project build process.