
“Front-end Developer Handbook 2019” (and its GitHub repository) is a good place to start for everyone looking to become a front-end developer.
“Front-end Developer Handbook 2019” (and its GitHub repository) is a good place to start for everyone looking to become a front-end developer.
There has been some noise in the mass media about the 996.ICU (official website) recently. That’s good, but I think we can do better. So, spread the word!
Here are a few bits to get you started:
The name
996.ICUrefers to “Work by ‘996’, sick in ICU”, an ironic saying among Chinese developers, which means that by following the “996” work schedule, you are risking yourself getting into the ICU (Intensive Care Unit).
What is 996?
A “996” work schedule refers to an unofficial work schedule (9 a.m.–9 p.m., 6 days per week) that has been gaining popularity. Serving a company that encourages the “996” work schedule usually means working for at least 60 hours per week. Visit 996 working hour system on Wikipedia for more details.
GitHub and Microsoft works support the 996.ICU initiative, as well as many other companies and teams.
BitBucket is celebrating an important milestone – 10 million registered users. With 28 million repositories and 3.5 million build minutes every week, BitBucket is a vital tool for many teams.
I am (and have been) a member of several teams and projects, which heavily rely on BitBucket (and BitBucket pipelines) for their day-to-day operation.
Happy 10 million milestone, BitBucket! Keep it the great work!
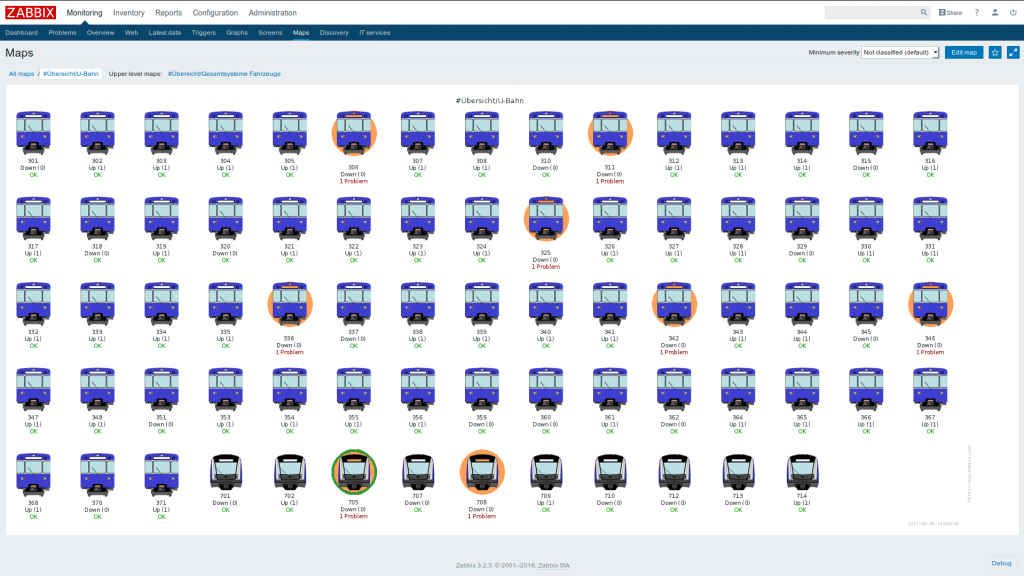
Zabbix blog shares a very inspiring post “Zabbix in the subway. Munich Transport Corporation Case Study“, which shows how Zabbix is used for the monitoring of the trains and trams in Munich. Here are some implementation details to get you started:
Currently, there are 3796 devices monitored by the Zabbix server, which in turn houses the MySQL database and the web front-end. This server is operated virtually with 8 CPU’s and 32GB RAM supported by SAS storage system. 105818 items are queried by the Zabbix server from those devices, where 23820 triggers detect whether certain items deviate from their target state. This results in 298.48 NVPS with an average of approx. 7 people (actively) using the system concurrently. General overview:
* Each device inside a tram/subway is treated as a host and is monitored for availability.
* Each tram/subway is managed as a host group.
* Host groups are nested and organized by the tram/subway lines (using the host group nesting feature introduced in Zabbix 3.2).
* All devices depend on the connectivity of the MRCU (Mobile Radio Control Unit in subways) or LTE router (LTE G4 Connectivity in trams)
* Maps are automatically created for each tram/subway (using the Zabbix API).
* Maps use sub-maps to link to a specific tram/subway view.
There’s also a video from the Zabbix conference, presenting the case study.
National Oceanic and Atmospheric Administration (NOAA) has this excellent visualization of the earthquakes recorded between January 1, 1901 and Decemeber 31, 2000. Each earthquake is shown as a circle, where the size indicates the strength and the color indicates the depth. Interesting, how most of these make up lines, showing the tectonic plate borders.