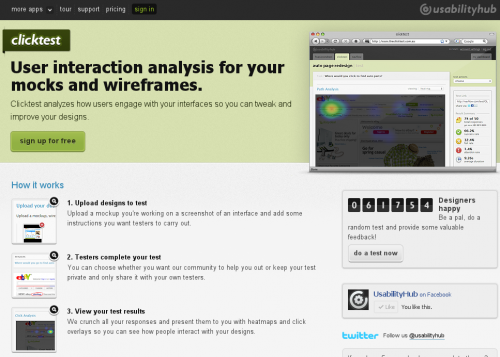
The Click Test – your own usability study group

When I came across The Click Test this morning I had one of those “why oh why didn’t I think of this myself?” moments. Both the idea and implementation are very simple, but extremely useful for anyone involved with interface design, usability studies or web development. When you want to try out a design or user interface concept or element, when you don’t know which version works better, or if you want to find out which element stands out for most people, you need a usability study, and The Click Test gives you everything you need to do one quickly. All you need to do is upload your design and ask the question. It will then be shown to a bunch of people who will answer your question by clicking somewhere in the design. You’ll see the results of your study as a heat map of user interaction. That’s it.

There are applications, even in a form of WordPress plugin, that would allow you to do a similar study directly on your website. That’s not news. But heaving a crowd of people to use for your test – now that’s brilliant. Now you can actually test something before putting it on the live website.
Google Analytics : Real Time Overview

In the last few month, Google Analytics team haven’t been getting much sleep I guess. They release features upon features upon features. I usually don’t have the time to properly check every feature they do right when they do it, so I keep a browser tab with an announcement open until I get to play with it. Sometimes though, either I lose the tab or close it or lose interest or lose hope that I will ever get to it.

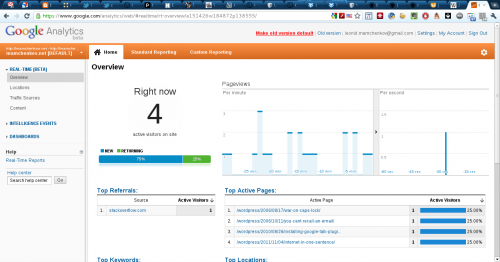
Somehow I managed to miss it completely or forget to play with the Real Time beta functionality of Google Analytics. Today I stumbled upon this feature in my reports and I have to say it’s absolutely awesome. If you can’t find it straight away, switch your Google Analytics interface to the new version, navigate to Home tab at the top, then choose Real Time (beta) in the menu on the left, and click on Overview. If you have any sort of traffic on your site at that moment, you’ll see a screen like this, which will update in real time.

During your regular hours, especially on the small sites, it would probably be too boring to watch. But it can save you a lot of time and pulled out hair during a traffic spike.

If I had a busy website and an office full of people, I’d probably put a big screen or a projection on a wall with full screen page of those stats. How cool would that be!

Statistics in a time of war

John D. Cook shares this interesting piece of history:

During WWII, statistician Abraham Wald was asked to help the British decide where to add armor to their bombers. After analyzing the records, he recommended adding more armor to the places where there was no damage!

This seems backward at first, but Wald realized his data came from bombers that survived. That is, the British were only able to analyze the bombers that returned to England; those that were shot down over enemy territory were not part of their sample. These bombers’ wounds showed where they could afford to be hit. Said another way, the undamaged areas on the survivors showed where the lost planes must have been hit because the planes hit in those areas did not return from their missions.

Wald assumed that the bullets were fired randomly, that no one could accurately aim for a particular part of the bomber. Instead they aimed in the general direction of the plane and sometimes got lucky.

It stories like this one, of a practical application, that make me regret of being a bad student.  I think that more of these should be a part of a curriculum.

Cyprus crude oil production by year

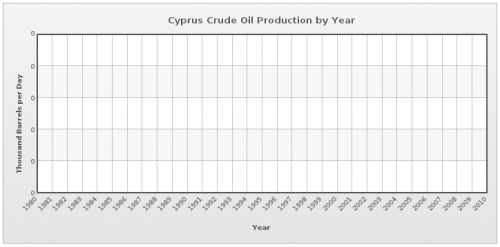
All the recent hype about oil and gas reserved discovery and exploration off the shores of Cyprus got me digging into the subject.   Here is one of the first graphs I found, which helps so much in understanding the current state of affairs.  Courtesy of Index Mundi website.

Just in case you prefer it in a table with raw data form, they have it for you there as well.