Stack Overflow published the results of their developer survey for 2016. Over 50,000 participants from more than 170 countries answered the questions this time around. Some of the results are quite predictable, while others less so.

Stack Overflow published the results of their developer survey for 2016. Over 50,000 participants from more than 170 countries answered the questions this time around. Some of the results are quite predictable, while others less so.
Here’s some not so light coffee time reading on IPv6 – IPv6 non-alternatives: DJB’s article, 13 years later – an article that links, among other things to this Ars Technica article, which features some IPv6 statistics. Summary? Sure. IPv6 RFC celebrates 20 year birthday this month with 10% global penetration.
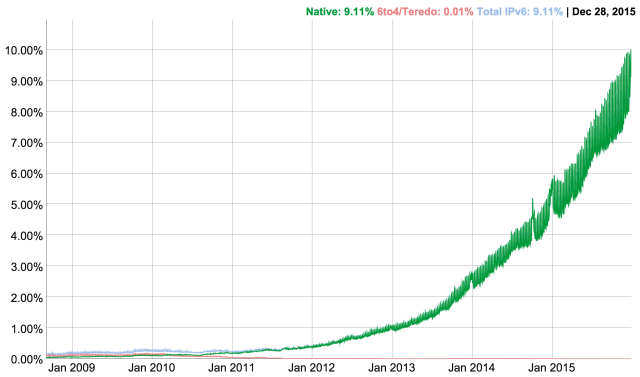
Exponential growth year-on-year is good. But the absolute numbers aren’t so bright yet. Especially considering some of the areas where it wasn’t so successful.
This year’s Jetpack annual report for this blog is ready – have a look. Here’s a teaser:
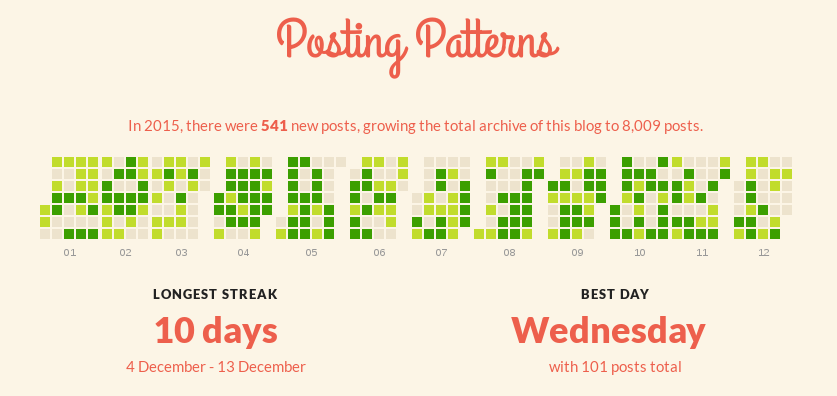
It’s been a busy year, so I haven’t been blogging as much as I wanted to, but overall, I think I did good (have a look at 2014 and 2013). Just to give you a quick comparison:
| Metric | 2013 | 2014 | 2015 |
|---|---|---|---|
| Visitors | 58,000 | 81,000 | 96,000 |
| Posts | 560 | 628 | 541 |
I blog mostly for myself, but it’s nice to see a slight grow in traffic. Although the fact that the most popular post in this blog throughout the years – how to check Squid proxy version – is a little concerning, yet funny. Well, at least people still find my “Vim for Perl developers” useful, even though it’s been more than 10 years since I wrote that (and probably five years since I promised to update it soon).
But as I said, I’m quite satisfied with my blogging this year. Hopefully I can continue to do the same in 2016.
Here’s an interesting set of experiments trying to answer the question of how far can you go with HAProxy setup on the smallest of the Amazon EC2 instances – t2.micro (1 virtual CPU, 1 GB of RAM). Here’s the summary.

At 460 req/second response times are mostly a flat ~300 ms, except for two spikes. I attribute this to TCP congestion avoidance as the traffic approaches the limit and packets start to get dropped. After dropped packets are detected the clients reduce their transmission rate, but eventually the transmission rate stabilizes again just under the limit. Only 1739 requests timeout and 134918 succeed.
[…]
It seems that the limit of the t2.micro is around 500 req/second even for small responses.

Back in 2013 I linked to some (not so) surprising facts about social media. Two years is a lot of time and a lot of things has changed since. So here comes 100 social media facts and statistics for 2015. These spread from general statistics to service-specific ones, including Facebook, Twitter, LinkedIn, Instagram, Pinterest, Google+, and others. Unlike many other similar collections, this one actually links to sources for every single fact, and provides an easy one-click share to Twitter button. Here are a few to get you started: