CPU Steal Time. Now on Amazon EC2

Yesterday I wrote the blog post, trying to figure out what is the CPU steal time and why it occurs.  The problem with that post was that I didn’t go deep enough.

I was looking at this issue from the point of view of a generic virtual machine.  The case that I had to deal with wasn’t exactly like that.  I saw the CPU steal time on the Amazon EC2 instance.  Assuming that these were just my neighbors acting up or Amazon having a temporary hardware issue was a wrong conclusion.

That’s because I didn’t know enough about Amazon EC2.  Well, I’ve learned a bunch since then, so here’s what I found.

Continue reading CPU Steal Time. Now on Amazon EC2

NAS Performance: NFS vs Samba vs GlusterFS

I came across this question and also found the results of the benchmarks somewhat surprising.

  • GlusterFS replicated 2: 32-35 seconds, high CPU load
  • GlusterFS single: 14-16 seconds, high CPU load
  • GlusterFS + NFS client: 16-19 seconds, high CPU load
  • NFS kernel server + NFS client (sync): 32-36 seconds, very low CPU load
  • NFS kernel server + NFS client (async): 3-4 seconds, very low CPU load
  • Samba: 4-7 seconds, medium CPU load
  • Direct disk: < 1 second

The post is from 2012, so I’m curious if this is still accurate. Has anybody tried this? Can confirm or otherwise?

Also, an interesting note from the answer to the above:

From what I’ve seen after a couple of packet captures, the SMB protocol can be chatty, but the latest version of Samba implements SMB2 which can both issue multiple commands with one packet, and issue multiple commands while waiting for an ACK from the last command to come back. This has vastly improved its speed, at least in my experience, and I know I was shocked the first time I saw the speed difference too – Troubleshooting Network Speeds — The Age Old Inquiry


How Far Can You Go With HAProxy and a t2.micro

Here’s an interesting set of experiments trying to answer the question of how far can you go with HAProxy setup on the smallest of the Amazon EC2 instances – t2.micro (1 virtual CPU, 1 GB of RAM).  Here’s the summary.

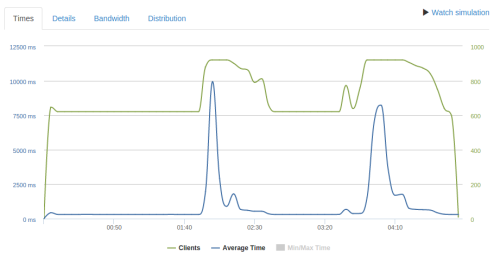
460 requests/second

At 460 req/second response times are mostly a flat ~300 ms, except for two spikes. I attribute this to TCP congestion avoidance as the traffic approaches the limit and packets start to get dropped. After dropped packets are detected the clients reduce their transmission rate, but eventually the transmission rate stabilizes again just under the limit. Only 1739 requests timeout and 134918 succeed.

[…]

It seems that the limit of the t2.micro is around 500 req/second even for small responses.

CPU Steal Time

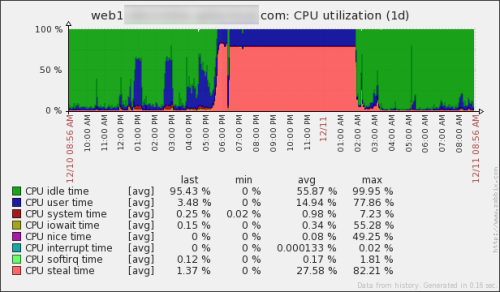
Here’s something that happens once in a blue moon – you get a server that seems overloaded while doing nothing.  There are several reasons for why that can happen, but today I’m only going to look at one of them.  As it happened to me very recently.

Firstly, if you have any kind of important infrastructure, make sure you have the monitoring tools in place.  Not just the notification kind, like Nagios, but also graphing ones like Zabbix and Munin.  This will help you plenty in times like this.
web1

When you have an issue to solve, you don’t want to be installing monitoring tools, and starting to gather your data.  You want the data to be there already.

Now, for the real thing.  What happened here?  Well, obviously the CPU steal time seems way off.  But what the hell is the CPU steal time?  Here’s a handy article – Understanding the CPU steal time.  And here is my favorite part of it:

There are two possible causes:

  1. You need a larger VM with more CPU resources (you are the problem).
  2. The physical server is over-sold and the virtual machines are aggressively competing for resources (you are not the problem).

The catch: you can’t tell which case your situation falls under by just watching the impacted instance’s CPU metrics.

In our case, it was a physical server issue, which we had no control over.  But it was super helpful to be able to say what is going.  We’ve prepared “plan B”, which was to move to another server, but finally the issue disappeared and we didn’t have to do that this time.

Oh, and if you don’t have those handy monitoring tools, you can use top:

top_steal

P.S. : If you are on Amazon EC2, you might find this article useful as well.
APC is dead, long live OPcache

Since this is probably common knowledge by now, this blog post is more a note to my future self.  APC is dead.  Don’t use it.  Use OPcache instead.  APCu is something else.

In the last few years I’ve had so much issues with APC, that I eventually stopped installing it on my servers by default.  Now that I need to squeeze every bit of performance for one of the projects, I looked back at it.  And tried it.  And once again it kicked me in the balls.  Then I remembered that I’ve seen APCu somewhere.  Maybe it’s a newer fork or something.

Gladly, after a quick Google search for the difference, I came across this discussion, which clarified a few things.

So out of those you named:

  • APC is opcode cache and data store
  • APCu is only data store
  • OPcache is only opcode cache

Since APC is older, at the moment you likely want OPcache as well as some data store, not necessarily APCu (although it is perfectly fine choice).

My interest was in opcode cache, since I already had a data store.  Installing and configuring OPcache needed just a few seconds, and didn’t cause any issues so far.

And if you want more information about it, here is a useful article, which, among other things, lists the helpful tools for monitoring and tweaking OPcache configuration.

3. How to check if OpCache is actually caching my files?

If you have already installed and configured OpCache, you may find it important to control which PHP files are actually being cached. The whole cache engine works in the background and is transparent to a visitor or a web developer. In order to check its status, you may use one of the two functions that provide such information: opcache_get_configuration() and opcache_get_status(). Fortunately, there is a couple of prepared scrips that fetch all the OpCache configuration and status data and display it in a friendly way. You don’t need to write any code by yourself, just pick up one of tools from these below:
Opcache Control Panel,
opcache-status by Rasmus Lerdorf,
OpCacheGUI by Pieter Hordijk,
opcache-gui by Andrew Collington.

May the Cache be with you.