vis.js – a visual interaction system

vis.js – a visual interaction system

Vis.js is a dynamic, browser based visualization library. The library is designed to be easy to use, to handle large amounts of dynamic data, and to enable manipulation of and interaction with the data. The library consists of the components DataSet, Timeline, and Graph.

The vis.js library is developed by Almende B.V, as part of CHAP. Vis.js runs fine on Chrome, Firefox, Opera, Safari, IE9+, and most mobile browsers (with full touch support).

Piecon – favicon with the progress bar

Piecon – favicon with the progress bar

This is an interesting idea.  Sadly, it didn’t work in my Google Chrome, even though it should be supported.  Works nicely in the Firefox though.  Follow the link to see the demo.


Christmas season and blog stats

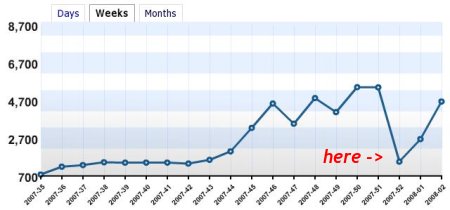
I don’t know exactly how all those online shops do during the Christmas seasons (probably they are blooming), but I can show you what two weeks or so of Christmas and New Year’s holidays can do to one’s blog statistics.  Here is a screenshot of weekly stats for my blog:

Weekly stats - Christmas edition

X-axis shows a few last weeks of 2007 as well as a couple of weeks of 2008.  Y-axis shows the number of visits this blog had for each of those weeks.  A home-made red marker with a word “here” tries to bring your attention to the celebration of Christmas and New Year represented on this graph.

As much as it was expected, that was quite a dive I must say.  Reasons?  I’d say there are only two:

  1. Many people are busy with shopping, celebrations, travels, and other holiday matters.  Mostly off-line.
  2. Many companies closed their offices and that minimized many employees’ access to the Web.

Gladly, things are rushing back to normal.