Here’s something that happens once in a blue moon – you get a server that seems overloaded while doing nothing. There are several reasons for why that can happen, but today I’m only going to look at one of them. As it happened to me very recently.
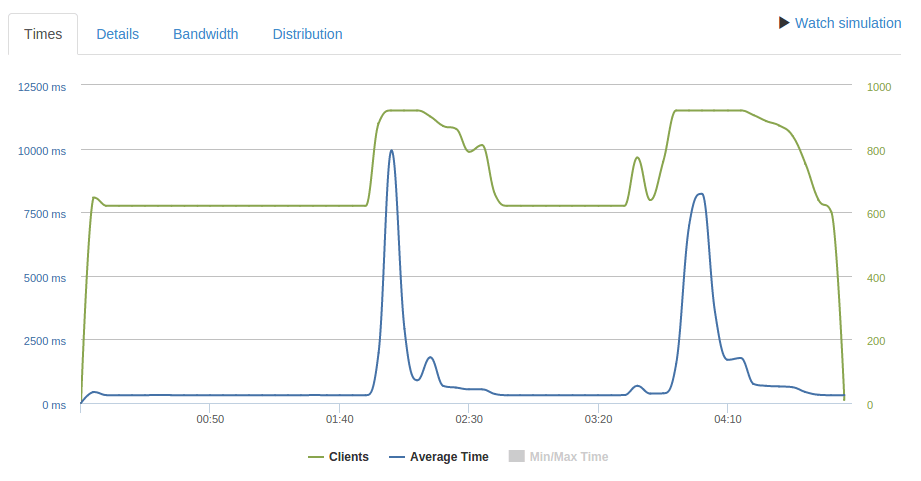
Firstly, if you have any kind of important infrastructure, make sure you have the monitoring tools in place. Not just the notification kind, like Nagios, but also graphing ones like Zabbix and Munin. This will help you plenty in times like this.

When you have an issue to solve, you don’t want to be installing monitoring tools, and starting to gather your data. You want the data to be there already.
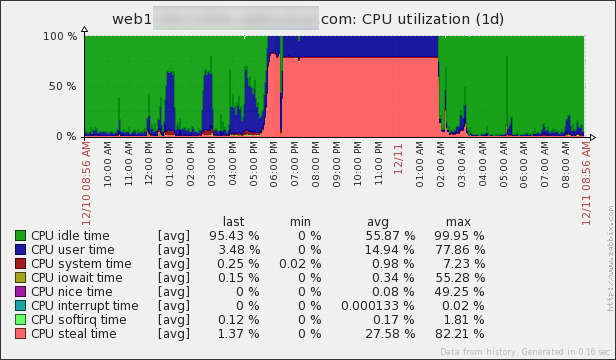
Now, for the real thing. What happened here? Well, obviously the CPU steal time seems way off. But what the hell is the CPU steal time? Here’s a handy article – Understanding the CPU steal time. And here is my favorite part of it:
There are two possible causes:
- You need a larger VM with more CPU resources (you are the problem).
- The physical server is over-sold and the virtual machines are aggressively competing for resources (you are not the problem).
The catch: you can’t tell which case your situation falls under by just watching the impacted instance’s CPU metrics.
In our case, it was a physical server issue, which we had no control over. But it was super helpful to be able to say what is going. We’ve prepared “plan B”, which was to move to another server, but finally the issue disappeared and we didn’t have to do that this time.
Oh, and if you don’t have those handy monitoring tools, you can use top:

P.S. : If you are on Amazon EC2, you might find this article useful as well.