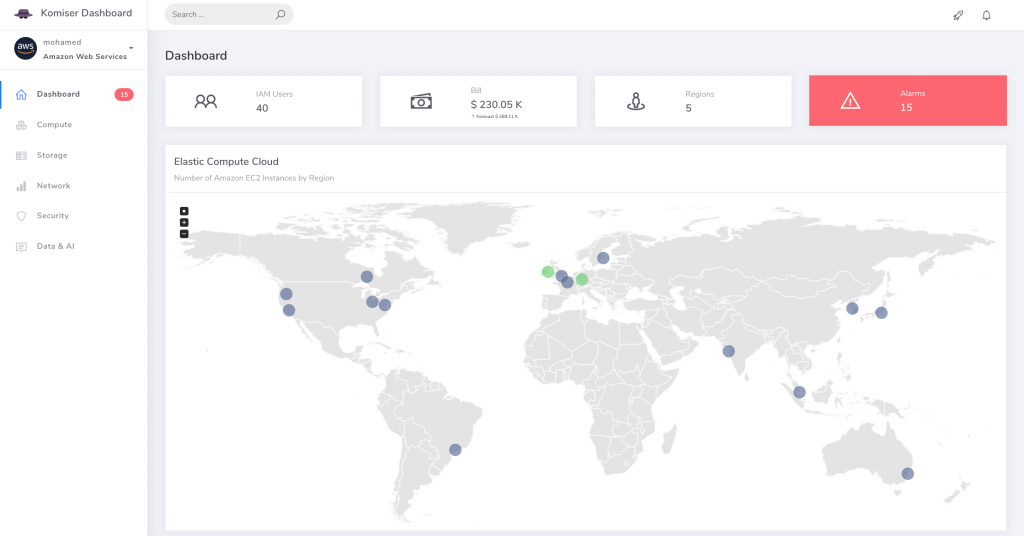
Komiser is a really nice tool that provides an overview of your Amazon AWS setup. After a super simple install, you’ll have a web console which visualizes your AWS regions and the resources you run in them. It’s great for getting a quick overview, as well as for some analyses of billing, security and utilization issues.
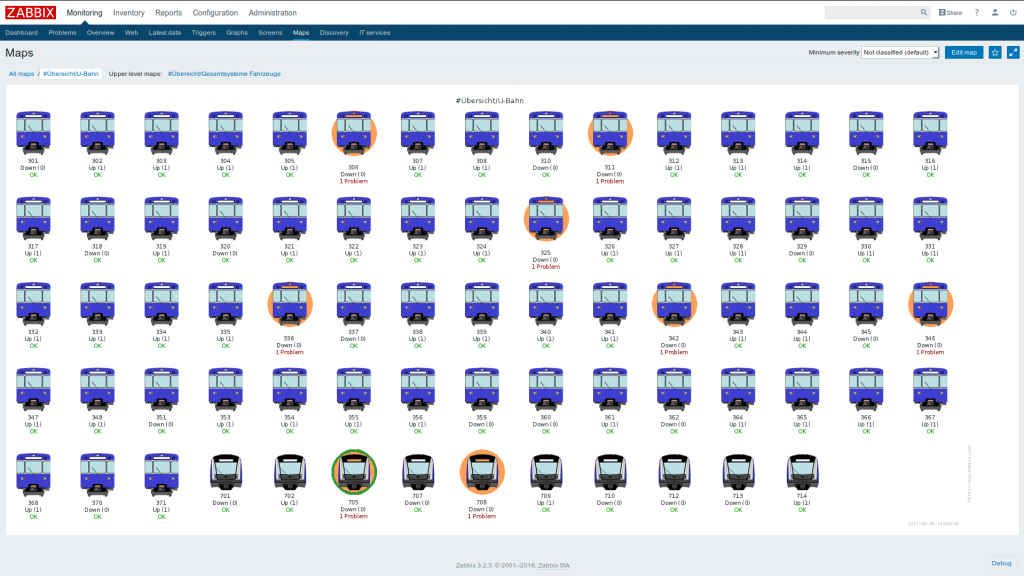
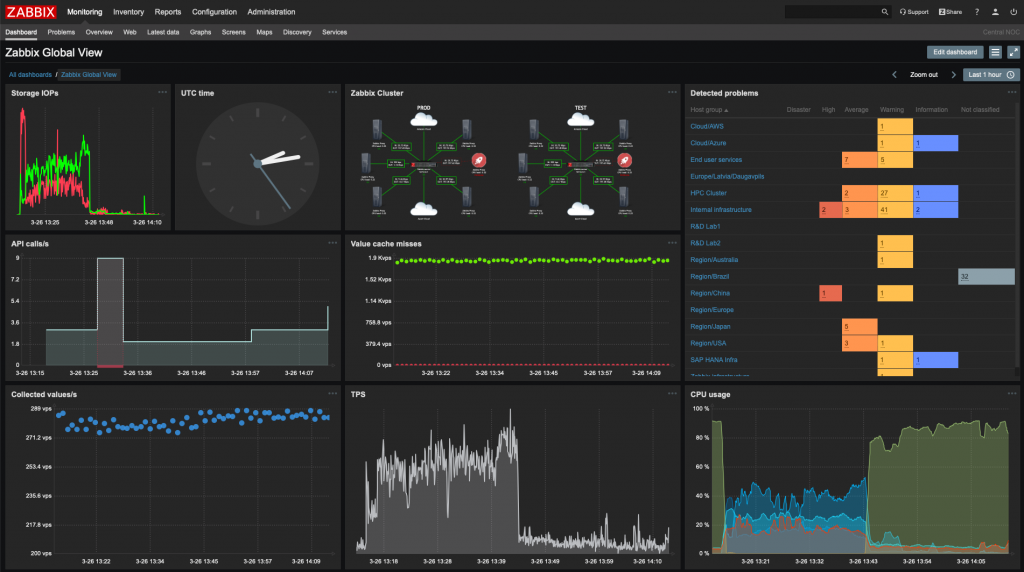
Currently, there are 3796 devices monitored by the Zabbix server, which in turn houses the MySQL database and the web front-end. This server is operated virtually with 8 CPU’s and 32GB RAM supported by SAS storage system. 105818 items are queried by the Zabbix server from those devices, where 23820 triggers detect whether certain items deviate from their target state. This results in 298.48 NVPS with an average of approx. 7 people (actively) using the system concurrently. General overview: * Each device inside a tram/subway is treated as a host and is monitored for availability. * Each tram/subway is managed as a host group. * Host groups are nested and organized by the tram/subway lines (using the host group nesting feature introduced in Zabbix 3.2). * All devices depend on the connectivity of the MRCU (Mobile Radio Control Unit in subways) or LTE router (LTE G4 Connectivity in trams) * Maps are automatically created for each tram/subway (using the Zabbix API). * Maps use sub-maps to link to a specific tram/subway view.
There’s also a video from the Zabbix conference, presenting the case study.
Logging, I think, is one of the least debated subjects in the software development. Everyone does it at least to some degree. Everyone agrees that good logs are important. But beyond that, there’s enough debate on what are the best practices, tools, and options. We need more of blog posts like this one and slides like these.
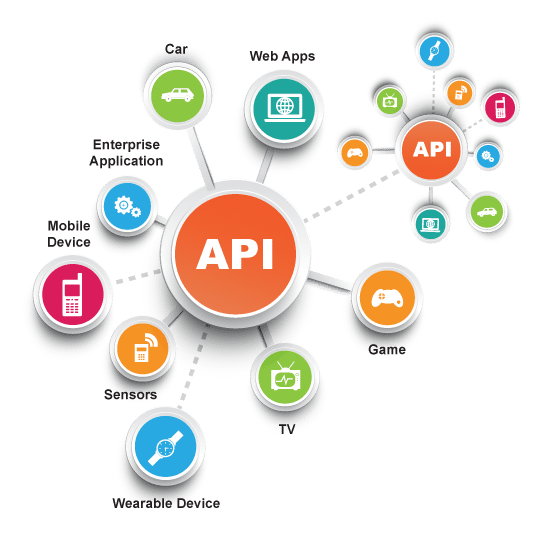
“12 Best API Monitoring Tools for Your Business” lists a bunch of services that are useful for the monitoring of your API. Read the whole thing for more details. Here’s the list of the services covered:
This website uses cookies to improve your experience while you navigate through the website. Out of these, the cookies that are categorized as necessary are stored on your browser as they are essential for the working of basic functionalities of the website. We also use third-party cookies that help us analyze and understand how you use this website. These cookies will be stored in your browser only with your consent. You also have the option to opt-out of these cookies. But opting out of some of these cookies may affect your browsing experience.
Necessary cookies are absolutely essential for the website to function properly. This category only includes cookies that ensures basic functionalities and security features of the website. These cookies do not store any personal information.
Any cookies that may not be particularly necessary for the website to function and is used specifically to collect user personal data via analytics, ads, other embedded contents are termed as non-necessary cookies. It is mandatory to procure user consent prior to running these cookies on your website.