Why software projects take longer than you think – a statistical model

Why software projects take longer than you think – a statistical model” is an interesting take on the problem of bad estimations in software projects. I’m not that great with math, but even then the article is very interesting. And there is a lot that I agree with.

Here’s a quote for those of you who couldn’t make it through:

Why software tasks always take longer than you think

Assuming this dataset is representative of software development (questionable!), we can infer some more numbers. We have the parameters for the t-distribution, so we can compute the mean time it takes to complete a task, without knowing the σ for that task is.


While the median blowup factor imputed from this fit is 1x (as before), the 99% percentile blowup factor is 32x, but if you go to 99.99% percentile, it’s a whopping 55 million! One (hand wavy) interpretation is that some tasks end up being essentially impossible to do. In fact, these extreme edge cases have such an outsize impact on the mean, that the mean blowup factor of any task ends up being infinite. This is pretty bad news for people trying to hit deadlines!
RethinkDB: why we failed


Startups are born and gone every single day.  Much more often so in technology sector.  Most of these just disappear into the ether.  RethinkDB at least leaves the useful trace of analysis of what happened and why they failed.

When we announced that RethinkDB is shutting down, I promised to write a post-mortem. I took some time to process the experience, and I can now write about it clearly.

In the HN discussion thread people proposed many reasons for why RethinkDB failed, from inexplicable perversity of human nature and clever machinations of MongoDB’s marketing people, to failure to build an experienced go-to-market team, to lack of numeric type support beyond 64-bit float. I aggregated the comments into a list of proposed failure reasons here.

Some of these reasons have a ring of truth to them, but they’re symptoms rather than causes. For example, saying that we failed to monetize is tautological. It doesn’t illuminate the reasons for why we failed.

In hindsight, two things went wrong – we picked a terrible market and optimized the product for the wrong metrics of goodness. Each mistake likely cut RethinkDB’s valuation by one to two orders of magnitude. So if we got either of these right, RethinkDB would have been the size of MongoDB, and if we got both of them right, we eventually could have been the size of Red Hat[1].

Thank you, guys.  There are valuable lessons in there.  And three points, of course:

If you remember anything about this post, remember these:

  • Pick a large market but build for specific users.
  • Learn to recognize the talents you’re missing, then work like hell to get them on your team.
  • Read The Economist religiously. It will make you better faster.


Ekisto – visualizing online habitats


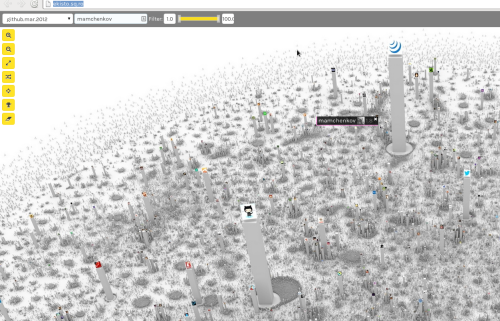
Slashdot is linking to Ekisto – a project to visualize online communities like if they were cities.  So far there are only GitHub, StackOverflow and Friendfeed (really? Friendfeed?).  I’ve seen plenty of data visualization, especially for GitHub, but I have to say that this is one of the most interesting ones ever.

github visualization


Here is a quote from the About page that explains how it works:

Ekisto comes from ekistics, the science of human settlements.

Ekisto is an interactive visualization of three online communities: StackOverflow, Github and Friendfeed. Ekisto tries to imagine and map our online habitats using graph algorithms and the city as a metaphor.

A graph layout algorithm arranges users in 2D space based on their similarity. Cosine similarity is computed based on the users’ network (Friendfeed), collaborate, watch, fork and follow relationships (Github), or based on the tags of posts contributed by users (StackOverflow). The height of each user represents the normalized value of the user’s Pagerank (Github, Friendfeed) or their reputation points (StackOverflow).


BayesDB – a Bayesian database table for querying the probable implications of data


BayesDB – a Bayesian database table for querying the probable implications of data

BayesDB, a Bayesian database, lets users query the probable implications of their data as easily as a SQL database lets them query the data itself. Using the built-in Bayesian Query Language (BQL), users with no statistics training can solve basic data science problems, such as detecting predictive relationships between variables, inferring missing values, simulating probable observations, and identifying statistically similar database entries.

BayesDB is suitable for analyzing complex, heterogeneous data tables with up to tens of thousands of rows and hundreds of variables. No preprocessing or parameter adjustment is required, though experts can override BayesDB’s default assumptions when appropriate.

BayesDB’s inferences are based in part on CrossCat, a new, nonparametric Bayesian machine learning method, that automatically estimates the full joint distribution behind arbitrary data tables.