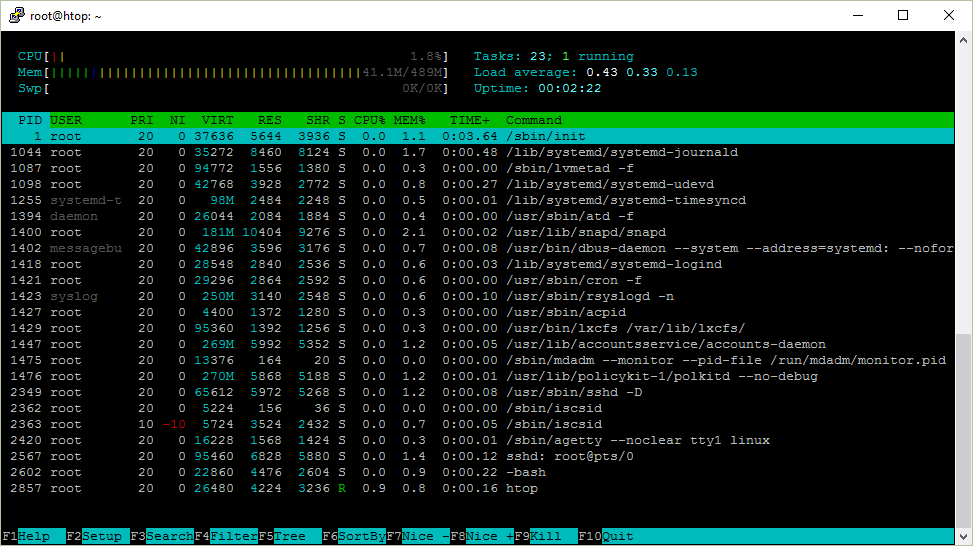
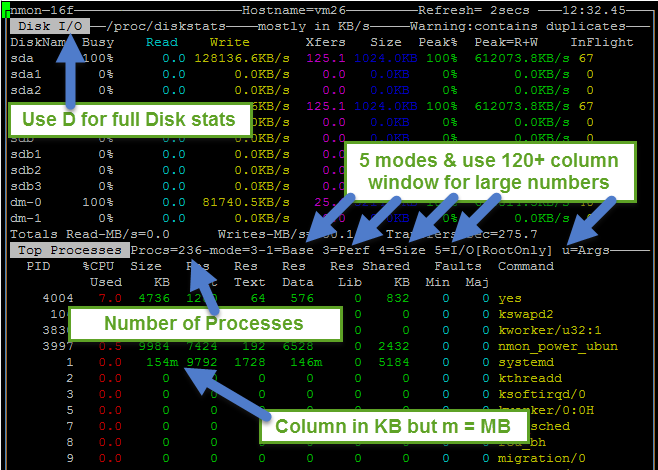
htop explained

htop explained” is a very detailed guide into the htop Linux system monitoring tool.  Even if you are an experienced Linux user, and even if you are not a fan of htop (why aren’t you?), you will still find this guide useful, as it goes into a lot of detail on how htop figures out all the values and where Linux keeps bits and pieces of system information.

Zabbix : No more flapping. Define triggers the smart way.

No more flapping. Define triggers the smart way.” is a very useful article from the Zabbix Weblog on how to setup sensible, flapping-aware triggers in Zabbix.

I’m sure every single person on this planet has a limit to how many up and down notifications he can receive …

Building the Right Alerting System

Here’s something I wanted to get into for a while now, but haven’t had the time yet – switching the monitoring / alerting system from server-oriented to business-oriented.  The gist of the story is:

If it’s not actionable and business critical, then it shouldn’t ring.

The article has some statistics and summaries as well.  The reasoning behind the switch is obvious, but it’s good to have it formulated:

After a few months, I can tell reducing our alerting rate should have been a top priority before things got out of hands, for a few reasons.

  • Constant alerts prevented the team to focus on what was important. Being interrupted even for things that can wait for a few hours lowers our productivity when we work on things that can’t wait.
  • Being awaken every night, several times a night exhausts a team and make people less productive at day, and more prone to do errors.
  • Too many off hours interventions cost the company a lot of money that could be invested in hardening the infrastructure or hiring someone else instead.

How to monitor your Linux servers with nmon

How to monitor your Linux servers with nmon” article provides some details on how to use the comprehensive server monitoring tool “nmon” (Nigel’s Monitor) to keep an eye on your server or two.  If you have more than a handful of servers, you’d probably opt out for a full blown monitoring solution, like Zabbix, but even with that, nmon can be useful for quick troubleshooting, screenshots, and data collection.

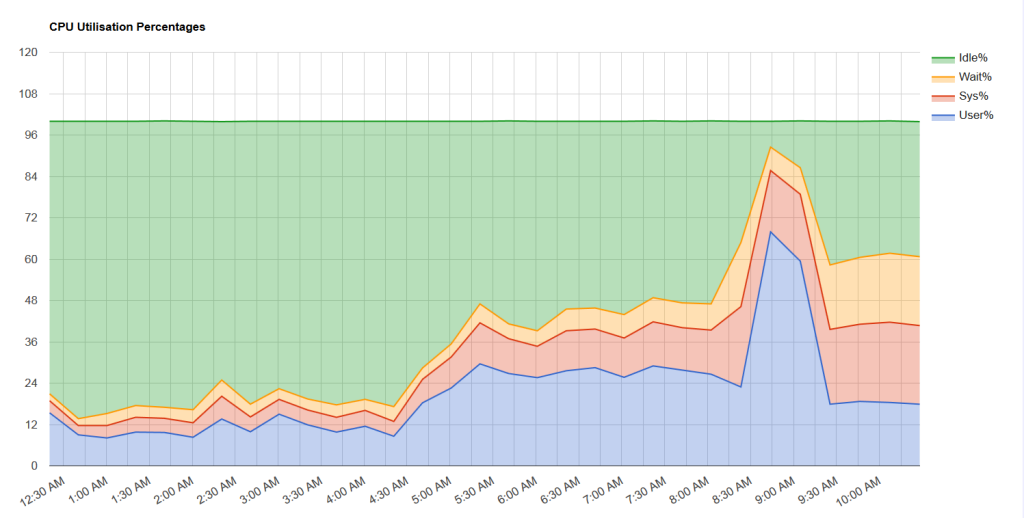
I’ve heard of nmon before and even used it occasionally.  What I didn’t know was that it can collect system metrics into a file, which can then later be analyzed and graphed with the nmonchart tool.

That’s pretty handy.  The extra bonus is that these tools are available in most Linux distributions, so there is no need to download/compile/configure things.


Nginx Amplify : comprehensive Nginx monitoring

Somehow I missed the announcement of the Nginx Amplify (beta) back in November of last year, so here it goes now.

Nginx Amplify is a new tool for the comprehensive monitoring of Nginx web servers.  Here’s what it can do for you:

  • Visually identify performance bottlenecks, overloaded servers, or potential DDoS attacks
  • Improve and optimize NGINX performance with intelligent advice and recommendations
  • Get alerts when something is wrong with the delivery of your application
  • Plan capacity and performance for web applications
  • Keep track of systems running NGINX

As well

as the regular proactive monitoring of the Nginx issues.  Have a look at the documentation for more details.