Chartbuilder / Gneisschart – a D3.js based front-end charting application that facilitates easy creation of simple beautiful charts

Chartbuilder / Gneisschart – a D3.js based front-end charting application that facilitates easy creation of simple beautiful charts. You can download and install it in your environment, or you can use a hosted version.

Chartbuilder

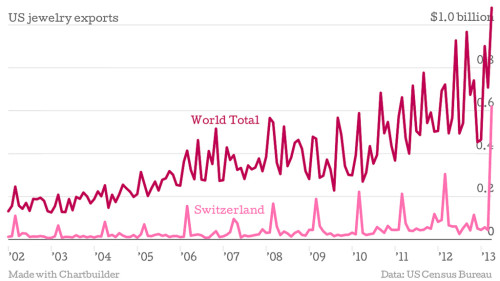
Chartbuilder was created to speed workflow in a newsroom and give reporters more responsibility over their content. It allows someone to create simple graphics quickly within a pre-specified style guide without needing specialized design software.

The output formats are can be used anywhere images and svgs are accepted. There’s no need for CMS integration or complex back end systems.

There are fewer excuses to use screenshots from analyst reports or charts in Excel.
Grafana – an open source, feature rich metrics dashboard and graph editor for Graphite, InfluxDB & OpenTSDB

Grafana – an open source, feature rich metrics dashboard and graph editor for  Graphite, InfluxDB & OpenTSDB

grafana dashboard

GitHub contributions graph

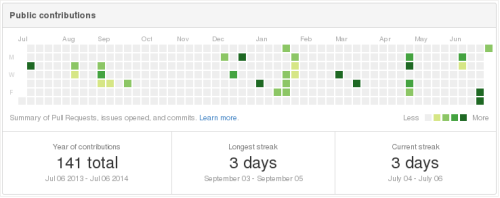
After reading Mark Story‘s “Coding every day” post, I started checking my own GitHub contributions chart once in a while.  Until today, I haven’t noticed that the chart has two different modes.  One is your public contributions, seen by people who are not part of your organization’s and private projects.  Here is how mine looks. (Notice the “Public contributions” title of the graph).

github public contributions

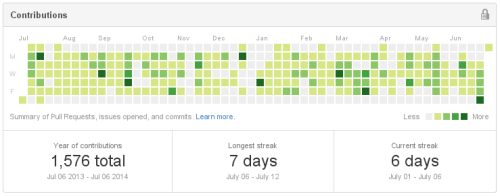
Yeah, I know, pathetic.  And here is how the full contributions chart looks like, for me and people who have access to see my private projects activities.  The graph is for the same period. (Notice a simpler “Contributions” title of the graph”).

github contributions


Could be better, but not as bad anymore.  Now with that I’ll try to push more stuff to the Open Source side of things again.

Cayley – an open-source graph

Cayley – an open-source graph inspired by the graph database behind Freebase and Google’s Knowledge Graph. Its goal is to be a part of the developer’s toolbox where Linked Data and graph-shaped data (semantic webs, social networks, etc) in general are concerned.

cayley