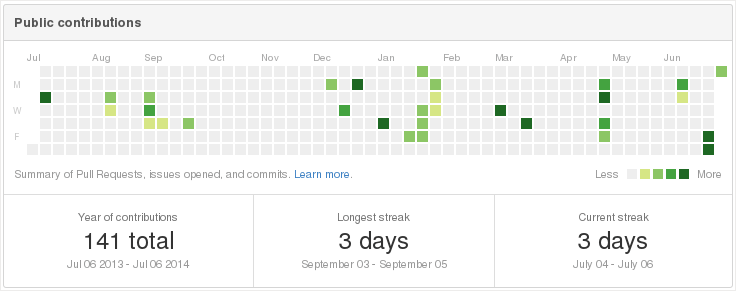
After reading Mark Story‘s “Coding every day” post, I started checking my own GitHub contributions chart once in a while. Until today, I haven’t noticed that the chart has two different modes. One is your public contributions, seen by people who are not part of your organization’s and private projects. Here is how mine looks. (Notice the “Public contributions” title of the graph).
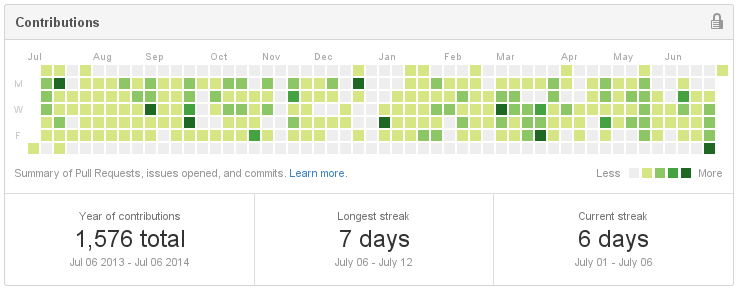
Yeah, I know, pathetic. And here is how the full contributions chart looks like, for me and people who have access to see my private projects activities. The graph is for the same period. (Notice a simpler “Contributions” title of the graph”).
Could be better, but not as bad anymore. Now with that I’ll try to push more stuff to the Open Source side of things again.
Noticed this a while ago, thought it was a bit disappointing then but suppose it does push open source
Sam ‘Shaggy’ Beale liked this on Facebook.