First of all, just to make it clear, I don’t recommend writing your own web statistics / analytics / tracking application. Google Analytics can track and report pretty much everything you will ever need. Period. If you think it can’t do it, chances are you just don’t know how. That’s much easier to correct than to write your own tracking / reporting application. I promise. In case though, Google Analytics doesn’t do something that you need, grab one of those Open Source applications and modify it to suit. While not as easy as learning Google Analytics, that would still be much easier than doing your own thing from scratch.
However, if you still decide to roll out your own tracker, here are a few things that you need to know.
- Use the bicycle, don’t reinvent it. Most of the tracking applications that I’ve seen use some form of JavaScript, which is appended right before the end of the page markup. Said JavaScript collects as much statistics as you need and generates a request to an image on the remote server (your tracking application), passing gathered statistics as parameters to the image. On the server side, your tracking application gathers sent parameters, merges them with whatever else you can get from the server side, and saves in the database or in your data storage of choice.
- Keep ad blocking applications in mind. Many ad blocking plugins for different browsers block 1×1 pixel images from remote servers. Be a bit more creative – use a 2×1 or a 1×2 pixel image. If it is a transparent GIF at the bottom of the page, nobody will notice it anyway.
- Gather as much as you can from the server side. It’s simpler, and you minimize the chances of breaking things with an URL which is too long (your GET request for the image with all parameters can run pretty long, especially if you pass current page and referring page URLs).
- Minimize the length of your parameter names and values when you pass them to image GET request. Again, this is to avoid extremely long URLs. You can sacrifice readability in your JavaScript and instead document parameters in the server side tracker application.
- Record both client’s IP address and possible proxy server’s IP address. That is available for you in the request headers ($_SERVER[‘HTTP_X_FORWARDED_FOR’] in PHP for example). Once you got the IP addresses, use GeoIP to lookup the country, region, city, coordinates, etc. It’s better to do so at the time you record the data. There is a free GeoIP service as well, but it will give you much less information. The commercial one is not that expensive.
- Record client’s browser information. Browsercap is very useful for that. However, it’s better to parse user agent string with browsercap at the report / export time, not at the request recording time. This will guarantee that you always have the most correct information about the browser in your report. Browsercap gets updated with new signatures pretty often.
- If you are tracking a secure site (HTTPS), chances are you won’t have referrer information available to you. Apparently, that’s a security feature.
- If you use both JavaScript and PHP to figure out the referrer, keep in mind that JavaScript uses document.referrer, while PHP uses $_SERVER[‘HTTP_REFERER’]. Notice that one is spelled with two Rs, while the other – with one. That might save you some troubleshooting time.
- It’s better to use the same JavaScript code snippet across all your sites. To avoid SSL-related security warnings, your JavaScript need to figure out if it’s in HTTPS web site or in plain HTTP one. See Google Analytics example on how to actually do that. It doesn’t hurt to have a signed SSL certificate for the HTTPS hosting of your tracker application.
- Don’t forget about HTML and URL escaping / encoding. Check that everything works properly for you in different browsers. JavaScript is still hard to nail right sometimes.
- Keep the version of tracker application in every request log entry. This will much simplify your migrations later. One of the ways to keep this automated is to use tags / keyword substitutions in your version control software (here is how to do this in Subversion).
- Make sure your tracker spits out that transparent image no matter what. Broken image icons are very visible and you don’t want those on your site just because your tracker database went down temporarily.
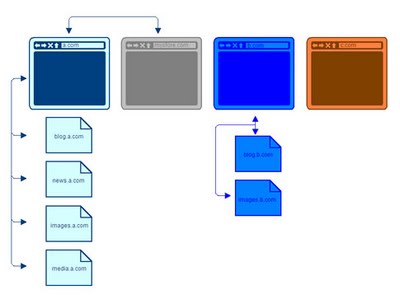
- For the best cross-site tracking, start tracker session, which will remain the same when visitor will go from one of your tracked web sites to another. If your tracked web sites use sessions, pass their IDs to tracker, so that both tracked and tracker session IDs could be logged in the same request. This will help you link stats from several sites together, as well as do all sorts of drill-downs into site-specific stats straight from the bird-view reports.
- Don’t be evil! There is a lot that you can collect about your visitors. Make sure that you tell them exactly what you are collecting and how you are using it. Aggregate and anonymize your logs to prevent negative consequences. I’m sure you know what I mean.
Once again, think really good before you decide to do one yourself. It’s not an easy job. And even if you grab all the data you want and save it in your database, there is an incomparably bigger issue to solve yet – reports, graphs, export, and overall visualization and analytics part of that data. Why would you even want to go into that?
