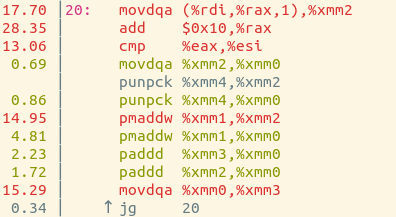
So instead I used perf, which is a totally magical performance measurement tool for Linux. I needed to upgrade my kernel first, which was a bit nervewracking. But I did it! And it was beautiful. There are colours, and we got it to annotate the assembly code with performance statistics. Here’s what I ran to do it:
$ perf record ./bytesum_intrinsics The\ Newsroom\ S01E04.mp4
$ perf annotate --no-source
And here’s the result:
The movdqa instructions have to do with accessing memory, and it spends 32% of its time on those instructions. So I think that means that it spends 32% of its time accessing RAM, and the other 68% of its time doing calculations. Super neat!
