Google Reader adds statistics and trends

I predict a huge spike of comparisons and boasting in the blogosphere in the next few days. The reason for such prediction is Google Reader’s newest feature – charts, trends, and stats.

The graphs and tables provide way more information that I could ask for. And all that fits nicely on a single page and is rather intuitive. How is that possible? What’s there? You have to check it for yourself, of course. But I’ll give you a brief description, just in case you don’t use Google Reader.
Google Reader statistics

There is a brief summary, which says something like:

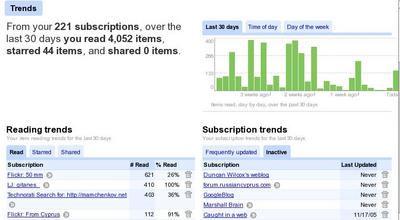
From your 221 subscriptions, over the last 30 days you read 4,052 items, starred 44 items, and shared 0 items.

I’ve spent a lot of time during the last two days, throwing out feeds that I don’t read. If only I knew…

Then, there is a little graph which has three tabs. The first tab shows the daily items read for the last 30 days. My highest spikes go to about 400 items per day. The second tab shows my reading activity during the hours of the day. For me, it appears, the busiest reading hours are in the early morning, around 3:00-4:00 am, at noon, and in the evening, around 07:00pm. The third tab shows my reading activity over days of week. Thursday seems to be my favourite reading day, with other weekdays following closely. Interestingly, on Saturdays I read twice as little as I do on Sundays.

Below are two tables. Left table displays my reading trends, and has three tabs. Right table shows subscriptions trends and has two tabs.

Reading trends table shows a few subscriptions with the number of posts read and the respective percentage of posts read against the total number of items in the subscription. Other two tabs show numbers for Starred and Shared items. I Star selected items, and never mark anything as Shared, because I use tag sharing features.

Subscription trends table has two tabs – one for Frequently Updated subscriptions, and another for Inactive subscription. Frequently Updated tab shows the number of new items per day, and percentage of read items. The Inactive tab shows the date of last update for each subscription.

And here is the best feature ever about this table – there is an Unsubscribe icon for each subscription. That means that it will take me about 10 second to identify very “noisy” subscriptions and very “silent” subscriptions and get rid off them. Thank you Google so much for this!

For each of this tables, there is a tiny control at the bottom of the table, that allows to switch between top 10, top 20, and top 40 items to display. Very nice touch as well.

Below those tables, there is a tag cloud. Tags are set in different font sizes and shades of grey – from very light to black. The help line nearby says: “The more items a tag has, the bigger it appears. The more of those items you have read, the darker it is.”

And I think that’s it…

Really, really great stuff! You should check it out.
Will RSS ever go big?

There is an interesting discussion at Wisdump about RSS and if it will ever become mainstream, whatever they mean by that.

Email is completely different since it allows people to communicate with one another while RSS just acts as an asynchronous communication tool. Every major online communication breakthrough (IRC, IM, etc) succeeded because it handled communication in a many-to-many relationship. RSS on the other hand is simply a one-way 1-to-many relationship and this is what will prevent it from ever making it big and changing the lives of people.

For me personally, RSS is not a communication tool anyway. It’s an information tool. Something that allows me to go through huge amounts of data without spending much time or effort.

And with my mother (and few other non-technical people that I know) reading RSS feeds via Bloglines, I’d say that RSS is halfway mainstream already. Whatever I mean by that.

Working hard

This sounds wrong, not in terms of statistics, of which I am not aware, but in terms of people’s behavior:

Here in the U.S. the annual average is a measly 13 days (Compared to Italy’s 42 and France’s 37): a pittance if you include time-off needed for weddings, complicated mid-week errands, parole violations and the odd humdinger of a hangover. Yet somehow more than 1/3rd of Americans don’t use all their vacation each year.

Quoted from Scott Berkun’s blog.

I don’t have any statistics handy about the average annual vacations in Cyprus, but my estimation is that it’s somewhere around 20 days. And I’d say about 2/3rds take all their vacation days and then some more with sick leaves, unnoticed missed days, emergencies, and stuff like that. And there are, of course, 15 public holidays or so every year.

I love this country!

Back from vacations in Platres

Reflection

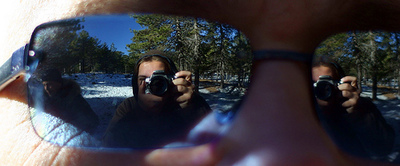
I am back from my short vacations. I went with my wife and son and a few friends to Platres village in Troodos mountains (these are some of my older photos – I wish there was that much snow this time). For three days and nights we stayed, once again, in the Forest Park Hotel.

Fresh mountain air, some snow, lots of good company, and plenty of food and drinks were just what I needed to recharge my batteries.

Here are a few things that I was surprised with:

  • I stayed offline for three days. There was Cytanet’s WiFi connectivity in the hotel, but I wasn’t too enthusiastic about the Web for those three days. I connected briefly only once, about an hour before midnight of the New Year Eve, just to look through my GMail messages. Haven’t even opened any of them.
  • I shot way too few pictures. Considering all the free time I had, all the nice people and beautiful scenery around, that wasn’t like regular me. All pictures have already been uploaded to New Year in Platres set at Flickr.
  • I haven’t got really drunk. Although I planned. Most of the drinking started inside, either at the taverna or at the hotel, but soon moved outside. Cool fresh air was, it turned out, stronger than vodka, which I had plenty of. Oh, well, I’m not sad about it. Just surprised. I had great time anyway.
  • I did lots of walking. Much more than I though I would. I walked even when everybody else refused to. I was going out alone and just walking in the forest. Definitely not like regular me.

As I said, I had great time and now I am rested and ready to jump back into blogging and programming – two activities that will occupy most of my time for the nearest future.

How was your New Year’s celebration?

Update: Here are more photos from the real photographer.