CSSPlot – charts with pure CSS
Tag: charts
Chartbuilder / Gneisschart – a D3.js based front-end charting application that facilitates easy creation of simple beautiful charts
Chartbuilder / Gneisschart – a D3.js based front-end charting application that facilitates easy creation of simple beautiful charts. You can download and install it in your environment, or you can use a hosted version.
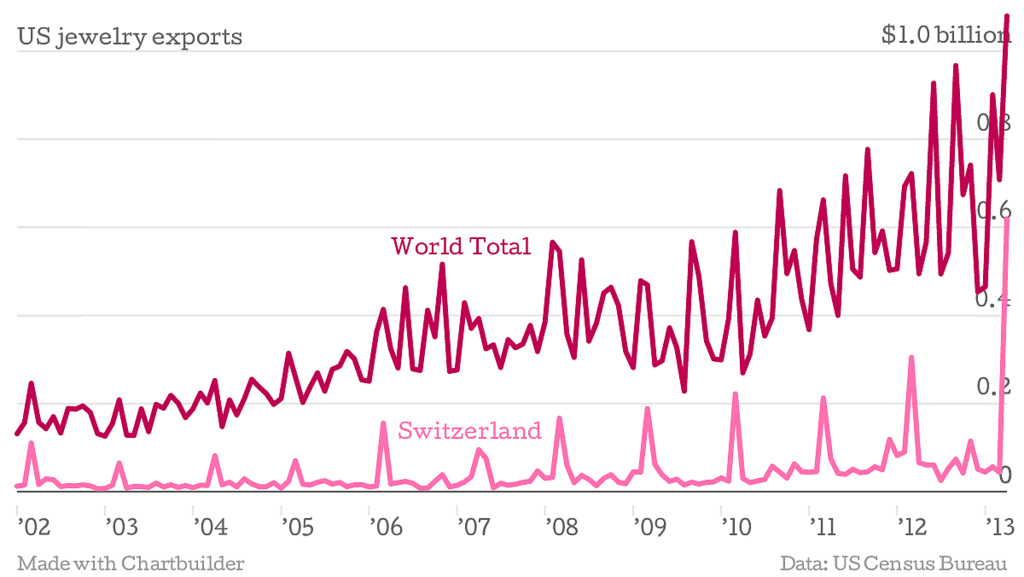
Chartbuilder was created to speed workflow in a newsroom and give reporters more responsibility over their content. It allows someone to create simple graphics quickly within a pre-specified style guide without needing specialized design software.
The output formats are can be used anywhere images and svgs are accepted. There’s no need for CMS integration or complex back end systems.
There are fewer excuses to use screenshots from analyst reports or charts in Excel.
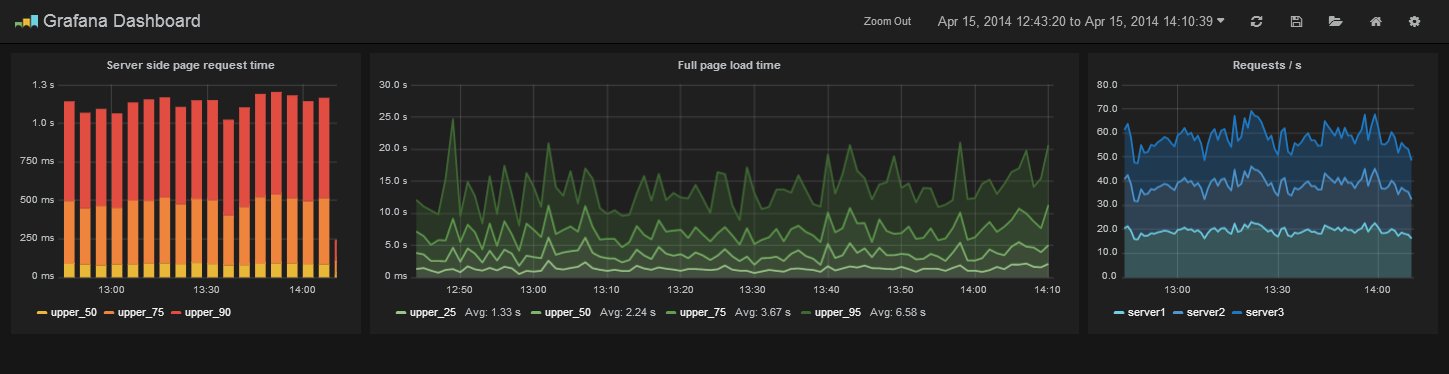
Grafana – an open source, feature rich metrics dashboard and graph editor for Graphite, InfluxDB & OpenTSDB
Grafana – an open source, feature rich metrics dashboard and graph editor for Graphite, InfluxDB & OpenTSDB
Chartist.js – simple responsive charts
Chartist.js – simple responsive charts.
The following facts should give you an overview why to choose Chartists as your front-end chart generator:
- Simple handling while using convention over configuration
- Great flexibility while using clear separation of concerns (Style with CSS & control with JS)
- Usage of SVG (Yes! SVG is the future of illustration in web!)
- Fully responsive and DPI independent
- Responsive configuration with media queries
- Fully built and customizable with SASS
c3.js – d3-based reusable chart library
c3.js – d3-based reusable chart library.
C3 makes it easy to generate D3-based charts by wrapping the code required to construct the entire chart. We don’t need to write D3 code any more.