Around us

I saw this dude today… Smiling eyes, huge cigar, and a little Japanese car that makes funny sounds. I saw this for maybe just a couple of seconds, but it was an instant and complete picture.

There is plenty of stuff going on around us at any given moment. Things which can’t be captured by photo or video cameras. Things that can’t be described properly. Each of those things exist for a mere moment. Next second it’s gone, vanished forever.

I just love it when I can catch a moment and enjoy…

Free Hugs

(OK, this is an old story, but I haven’t paid due attention before, and only found out about it today, via this photograph at Flickr)

Free Hugs is an amazing movement. People just make signs with “Free Hug” and go out on the streets, offering free hugs to strangers. It’s all about loving people for who they are, and sharing the good feelings with the world.

I have a mixed feeling about it. On one hand, I think that’s an excellent idea. It’s perfectly normal and all that, and the world does need more love. (Just read through some hugstories at the official web site.) On the other hand, I know that I won’t be making a sign and going out on the street any time soon. Although, if I see someone with the sign, I’d give him or her a hug.

Why wouldn’t I make a sign myself? The jury is still out on that one. It’ll take me some time to figure that out, but the two leads for now are insecurities and cultural atmosphere in Cyprus.

Before you run away from this blog and never come back, please take the time to watch this video, read this Wikipedia page, check this discussion at digg, and look through this article. If you are still here, please, leave a comment.

Spectacular physics

Science can be a lot of fun. Any science. But chemistry and physics do have some bonus potential as they both deal with all sorts of different materials. Applying and extracting energy, as well as other “special effects” can result in some ultimate coolness.

Check these videos for some really amazing stuff. My favourite is the video with ferrofluids presentation. What’s yours?

More on RSS : PostRank

It seems that there is a lot of activity around RSS lately (does that answer the “will RSS ever go big?” question?). I am interested in this subject, because I use RSS a lot (here are some stats from recently released trends feature in Google Reader) and because I was involved in development of RSS reader – a project dear to me, and frozen to death at the moment, but with plenty of hopes on my side to unfreeze it one day.

One of the major challanges, when creating RSS reader, is trying to solve the “information overload” problem. There are a number of ways to ago about, and none of those that I saw worked well enough. In our RSS reader we used something very simple, based on the user’s reading habbits – feed access counts, items read counts, items bookmarked and followed counts – all measured against feed activity.

Today I came across some excellent thinking at Ilya Grigorik’s blogpart 1 and part 2. There was also a link to RSS habbits study by Microsoft.

Something tells me that RSS readers will change a lot in the next few years…

Google Reader adds statistics and trends

I predict a huge spike of comparisons and boasting in the blogosphere in the next few days. The reason for such prediction is Google Reader’s newest feature – charts, trends, and stats.

The graphs and tables provide way more information that I could ask for. And all that fits nicely on a single page and is rather intuitive. How is that possible? What’s there? You have to check it for yourself, of course. But I’ll give you a brief description, just in case you don’t use Google Reader.
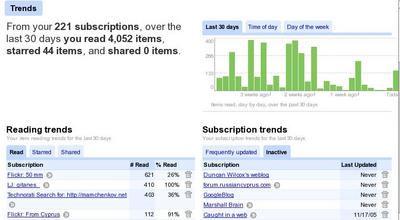
Google Reader statistics

There is a brief summary, which says something like:

From your 221 subscriptions, over the last 30 days you read 4,052 items, starred 44 items, and shared 0 items.

I’ve spent a lot of time during the last two days, throwing out feeds that I don’t read. If only I knew…

Then, there is a little graph which has three tabs. The first tab shows the daily items read for the last 30 days. My highest spikes go to about 400 items per day. The second tab shows my reading activity during the hours of the day. For me, it appears, the busiest reading hours are in the early morning, around 3:00-4:00 am, at noon, and in the evening, around 07:00pm. The third tab shows my reading activity over days of week. Thursday seems to be my favourite reading day, with other weekdays following closely. Interestingly, on Saturdays I read twice as little as I do on Sundays.

Below are two tables. Left table displays my reading trends, and has three tabs. Right table shows subscriptions trends and has two tabs.

Reading trends table shows a few subscriptions with the number of posts read and the respective percentage of posts read against the total number of items in the subscription. Other two tabs show numbers for Starred and Shared items. I Star selected items, and never mark anything as Shared, because I use tag sharing features.

Subscription trends table has two tabs – one for Frequently Updated subscriptions, and another for Inactive subscription. Frequently Updated tab shows the number of new items per day, and percentage of read items. The Inactive tab shows the date of last update for each subscription.

And here is the best feature ever about this table – there is an Unsubscribe icon for each subscription. That means that it will take me about 10 second to identify very “noisy” subscriptions and very “silent” subscriptions and get rid off them. Thank you Google so much for this!

For each of this tables, there is a tiny control at the bottom of the table, that allows to switch between top 10, top 20, and top 40 items to display. Very nice touch as well.

Below those tables, there is a tag cloud. Tags are set in different font sizes and shades of grey – from very light to black. The help line nearby says: “The more items a tag has, the bigger it appears. The more of those items you have read, the darker it is.”

And I think that’s it…

Really, really great stuff! You should check it out.