Chartbuilder / Gneisschart – a D3.js based front-end charting application that facilitates easy creation of simple beautiful charts

Chartbuilder / Gneisschart – a D3.js based front-end charting application that facilitates easy creation of simple beautiful charts. You can download and install it in your environment, or you can use a hosted version.

Chartbuilder

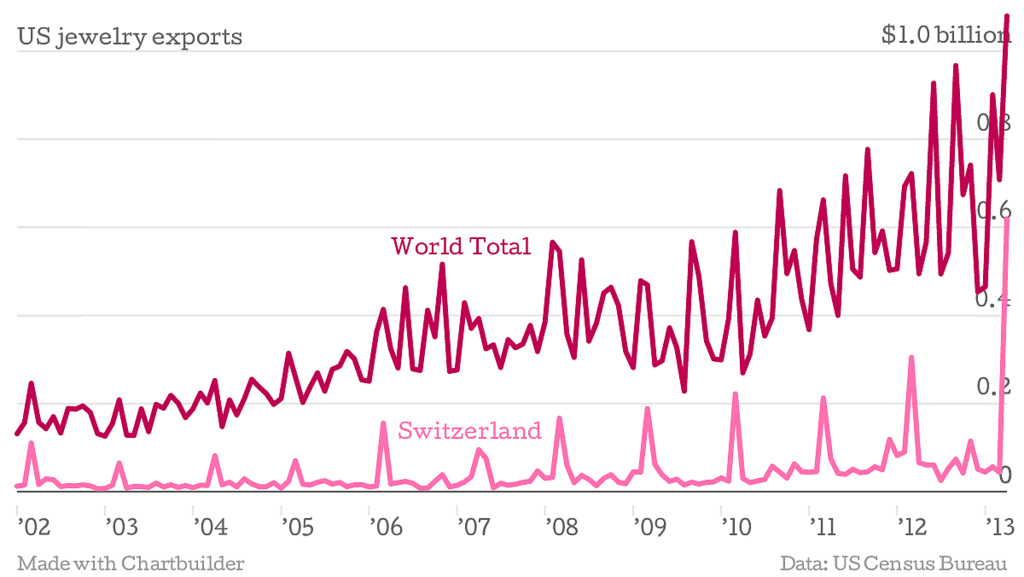
Chartbuilder was created to speed workflow in a newsroom and give reporters more responsibility over their content. It allows someone to create simple graphics quickly within a pre-specified style guide without needing specialized design software.

The output formats are can be used anywhere images and svgs are accepted. There’s no need for CMS integration or complex back end systems.

There are fewer excuses to use screenshots from analyst reports or charts in Excel.

Grafana – an open source, feature rich metrics dashboard and graph editor for Graphite, InfluxDB & OpenTSDB

Grafana – an open source, feature rich metrics dashboard and graph editor for  Graphite, InfluxDB & OpenTSDB

grafana dashboard

Extract, Transform, Load

I’ve been doing all kinds of data migrations and system integration for years now.  But only yesterday I’ve learned that there is a very specific term linked to the process.

In computing, extract, transform, and load (ETL) refers to a process in database usage and especially in data warehousing that:

  • Extracts data from outside sources
  • Transforms it to fit operational needs, which can include quality levels
  • Loads it into the end target (database, more specifically, operational data store, data mart, or data warehouse)

ETL systems commonly integrate data from multiple applications, typically developed and supported by different vendors or hosted on separate computer hardware. The disparate systems containing the original data are frequently managed and operated by different employees. For example a cost accounting system may combine data from payroll, sales and purchasing.